
collections_bookmark
Part of Bloomburrow


 ·
Sorcery
·
Foundations (FDN)
·
Sorcery
·
Foundations (FDN)
Live Play Data
Chart a Course
·
Sorcery
·
Foundations (FDN)
1%
Live Inclusion
Times Brought
513
Decks Running
263
Median Cast Turn
6
Drawn → Played
65%
Format
First-cast turn
n=83
2%
T1
5%
T2
14%
T3
17%
T4
11%
T5
43%
T6-9
7%
T10+
Median
6
P25
4
· P75
8
· max
13
On curve
7%
(4 / 83 cast on T2)
Cast same turn as drawn
32%
The "good card" funnel
513 brought · 247 playersBrought to game
513
Ever drawn
127
Reached battlefield
83
Still on board at game end
3
≥ -2.3pp
Players who cast this card win 26% of the time (n=76) , vs 19% when it never left the library (n=329).
When players drew this card but left it in hand, they won 21% (n=39).
Read this as correlation, not as the card's contribution. Casting a card means you lived long enough to cast it, so this gap widens with mana value across every card we track.
Observed gap +7.4pp; 95% confidence interval -2.3pp to +17.1pp. Correlational, not causal: powerful payoffs also get cast more often in games you are already winning.
Final zone distribution
140 instances4.3%
Library
2.1%
Battlefield
68.6%
Graveyard
4.3%
Exile
Commanders that played this card
in tracked games-
1
Zinnia, Valley's Voice

 50 decks
-
2
Sonic the Hedgehog
11 decks
-
3
Octavia, Living Thesis
8 decks
-
4
Tamiyo, Inquisitive Student // Tamiyo, Seasoned Scholar
 7 decks
-
5
Captain Howler, Sea Scourge
6 decks
-
6
Edward Kenway
 5 decks
-
7
Runo Stromkirk // Krothuss, Lord of the Deep
5 decks
-
8
The Mindskinner
5 decks
-
9
Vnwxt, Verbose Host
5 decks
-
10
Bria, Riptide Rogue
4 decks
Card text
Chart a Course
Sorcery
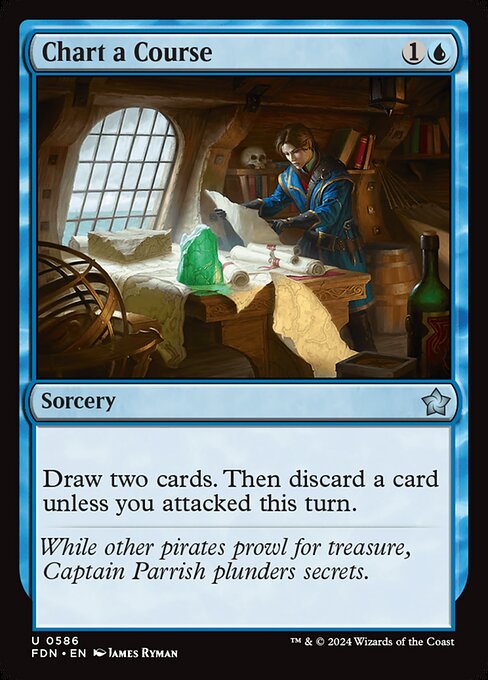
Draw two cards. Then discard a card unless you attacked this turn.
Foundations (FDN)
·
Uncommon
·
Illustrated by James Ryman
Frequently Asked
Why isn't there more data on this card?
Playgroup Live collects per-card gameplay data from real Commander games. Play counts appear once a card reaches 100 tracked games, and the full charts need a sample of at least 25 observed games that is not dominated by a single pilot. Until this card clears those bars you're seeing only the basic counts. Stats refresh nightly.
How is Playgroup Live card data collected?
Players using Playgroup Live import their decklists before a game and log card actions as they play. Each cast, zone change, and resolution is recorded as a real game event. Stats on this site are computed from those events, not from decklist scrapes or theorycrafting. Playgroup has recorded 720,000+ Commander games overall, and this card-level play data comes from the Playgroup Live seats playing virtual cards, a subset of that corpus.